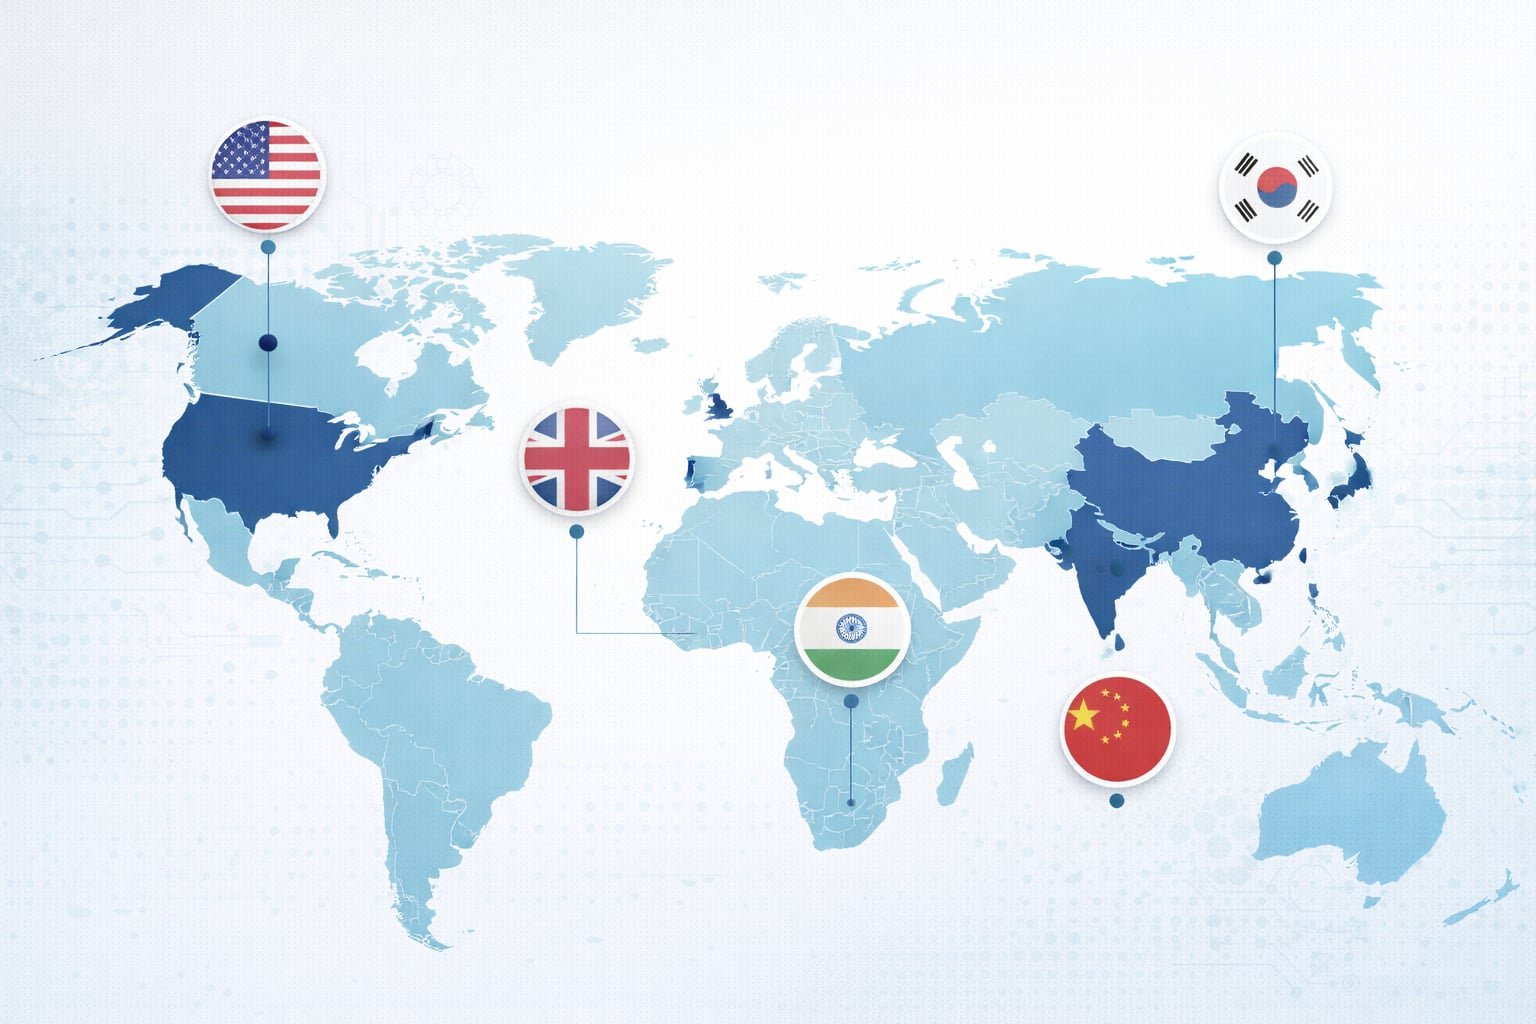
Introduction
Artificial intelligence has transitioned from experimental technology to mainstream global phenomenon. As we head further into 2026, the adoption of AI tools and services varies dramatically across nations, reflecting differences in infrastructure, investment, regulation, and digital culture. According to the latest global research, 378 million people are projected to use AI globally by 2025, marking a remarkable 64 million increase from the previous year[1]. This article examines which countries lead in AI adoption, why some nations outpace others, and what the future holds for global AI integration.
The Global AI Adoption Landscape
North America Leads in Corporate Adoption
North America remains the regional frontrunner in enterprise AI deployment. North America leads with 27% of its working-age population using AI tools, significantly ahead of Europe and Central Asia at 22%[2]. Meanwhile, organizations in the region show even higher enthusiasm: approximately 61% of North American respondents reported AI adoption in 2023, demonstrating that corporate investment drives broader population usage[3].
The United States, in particular, dominates the global AI investment landscape. The U.S. is projected to invest over $470.9 billion in artificial intelligence in 2025, dwarfing all other nations combined[4]. This massive investment supports:
-

 73% of global AI
compute power controlled by American companies[5]
73% of global AI
compute power controlled by American companies[5]
- 61% of American financial institutions deploying AI solutions[6]
 520+ FDA-approved
AI-based medical devices—more than the next five countries combined[7]
520+ FDA-approved
AI-based medical devices—more than the next five countries combined[7]
 85% of U.S. tech
firms actively using AI, far exceeding the global average of 62%[8]
85% of U.S. tech
firms actively using AI, far exceeding the global average of 62%[8]
China's State-Driven AI Strategy
China emerges as the second major player, but through a fundamentally different approach. China is investing approximately $119.3 billion in AI in 2025, supplemented by its National AI Industry Investment Fund with an initial allocation of $8.2 billion[4][9].
What distinguishes China's AI ecosystem:
![]()
- 60% of global AI patents are expected to be held by China, according to the World Intellectual Property Organization[10]
- Chinese IT
professionals report 60% adoption rates among companies actively incorporating AI[11]
China's challenge: awareness gaps exist, with only 31-34% of populations realizing they use AI-powered technologies[12].
Leading Countries in AI User Adoption Rates
According to the most recent Microsoft research from January 2026, a clearer picture emerges when measuring AI usage by working-age population share[13]:
Top 10 Countries by AI User Adoption Rate
- United Arab Emirates – 64.0% - Extends its lead with the highest working-age population adoption, up from 59.4% earlier in 2025[13]
- Singapore – 60.9% - Maintains second place with government-backed AI initiatives and worker upskilling[13]
- Norway – 45.3% - Strong Scandinavian digital infrastructure[13]
- Ireland – 41.7% - European tech hub benefits from digital readiness[13]
- France – 40.9% - Advanced digital infrastructure supports adoption[13]
- Spain – 39.7% - Mediterranean tech development accelerates[13]
- New Zealand – 37.6% - Paci c region AI leader[13]
- United Kingdom – 36.4% - Home to first AI Safety Institute[13]
- Netherlands – 36.3% - Northern European digital strength[13]
- Qatar – 35.7% - Middle Eastern AI investment pays dividends[13]
Notable observation: The United States ranks 23rd with 26.3% adoption, despite leading in investment and corporate deployment. This distinction between corporate deployment and personal usage proves critical to understanding global AI trends[13].
AI Readiness vs. Actual Usage: A Critical Distinction
Government and Enterprise Readiness Index
Different metrics reveal different rankings. The Oxford Insights Government AI Readiness Index and BCG's AI Maturity Matrix present another perspective[14]:
|
Ran k |
Country |
Readiness Score |
Key Strength |
|
1 |
United States |
87.03 |
Private investment & compute dominance |
|
2 |
China |
82.14 |
Government planning & scale |
|
3 |
Singapore |
80.79 |
National strategy & public- private collaboration |
|
4 |
United Kingdom |
78.92 |
AI safety governance & research |
|
5 |
Canada |
78.18 |
Ethical frameworks & deep learning research |
|
6 |
South Korea |
77.96 |
Technical infrastructure & robotics |
|
7 |
France |
77.53 |
Research excellence & startups |
|
8 |
Germany |
76.63 |
Industrial applications & Industry 4.0 |
|
9 |
Netherland s |
75.29 |
Strategic specialization & logistics AI |
|
10 |
Japan |
74.81 |
Robotics integration & Society 5.0 initiative |
The disconnect between readiness scores and actual adoption rates reveals important dynamics: countries with strong AI infrastructure don't always translate this into widespread personal usage[13][14].
Regional Patterns in AI Adoption
European Leadership in Accessibility
Europe demonstrates surprising strength in user-facing AI adoption:
- Nordic countries (Denmark, Finland, Sweden) average 26.6% adoption rates[13]
- Germany – 26.5%, leveraging manufacturing applications[13]
- Central European acceleration, with Poland (26.4%), Czech Republic (26.0%), and Hungary (27.9%) showing rapid growth[13]
The European model emphasizes accessibility and regulation, with the EU's AI Act shaping responsible deployment frameworks[13].
Asia-Pacific Divergence
Asia presents a bifurcated landscape:
High adoption: Singapore (60.9%), Taiwan (26.4%), Australia (34.5%)[13]
Emerging adoption: India reports 81% AI usage among residents but with awareness challenges—only 42% of Indian populations realize they're using AI-powered services[12]. However, 96% of Indian professionals expect to use AI tools at work by 2025, driven by the $1.24 billion IndiaAI Mission[15].
Lagging regions: South Asia and Sub-Saharan Africa remain below 13% adoption, reflecting the persistent digital divide[2].
The Americas Mixed Picture
North America: As discussed, leads corporate adoption but moderate user adoption (U.S. 26.3%, Canada 33.5%)[13]
South America: Brazil stands out with 82% AI usage rates, though awareness remains low at 34%[12].
Awareness Gaps: A Hidden Challenge
A critical finding emerges across research: many AI users don't realize they're using AI[12].
|
Country |
AI Usage Rate |
Awareness Rate |
|
Brazil |
82% |
34% |
|
India |
81% |
42% |
|
United States |
63% |
51% |
|
Netherlands |
58% |
53% |
Table 1: AI Usage vs. Awareness Gap (2024-2025)
This gap highlights a critical education opportunity: as AI integrates silently into apps, platforms, and services, users often experience AI benefits without explicit recognition. This phenomenon proves particularly pronounced in emerging markets where AI integration happens through mobile- first platforms and social commerce[12].
Sectoral AI Deployment by Country
Financial Services Leadership
United States: 61% of financial institutions deployed AI[6]
China: 68% adoption rate with government oversight[1]
Singapore: 64% adoption, leveraging fintech ecosystem[1]
The financial sector leads globally because AI delivers measurable ROI—JPMorgan Chase's fraud detection reduced false positives by 35%, saving $150 million annually[6].
Healthcare Transformation
China: 76% hospital AI adoption, reflecting government mandate[1]
Singapore: 92% diagnostic accuracy through AI systems[1]
United States: 42% healthcare system adoption, with 520+ FDA-approved AI devices[1][6]
Healthcare AI addresses urgent capacity challenges, particularly in aging societies like Japan, which has deployed 15,000+ AI care robots[1].
Manufacturing and Robotics
South Korea: 390 robots per 10,000 workers, highest robotics density globally[1]
Germany: 55% manufacturing AI adoption through Industry 4.0 initiatives[1]
United States: 45% facility adoption with 87% growth in predictive maintenance since
2020[1]
Retail and E-Commerce
China: 92% e-commerce AI penetration, driven by massive platforms[1]
United States: 68% adoption in customer analytics; Amazon uses AI to drive 35% of total sales[1]
Global trend: AI-powered recommendations and inventory optimization become table- stakes for e-commerce competitiveness[1].
Investment and Funding: The Money Behind Adoption
Government commitment directly correlates with adoption rates:
|
Country |
2025 AI Investment (USD Billions) |
|
United States |
$470.9 |
|
China |
$119.3 |
|
United Kingdom |
$28.2 |
|
Canada |
$15.3 |
|
Israel |
$15.0 |
|
Germany |
$11.3 |
|
India |
$11.1 |
|
France |
$9.0 |
|
South Korea |
$7.3 |
|
Singapore |
$7.3 |
Table 2: Government AI Investment Commitments by Country (2025)
Key insight: The U.S. invests nearly 4x more than China, yet adoption rate rankings tell a different story. This suggests that investment volume alone doesn't determine user adoption—accessibility, user experience, and integration into daily services matter equally[4][16].
Public Sentiment: Trust and Optimism Varies Widely
Beyond usage metrics, public sentiment shapes adoption trajectories:
High Optimism Regions
- China – 83% view AI as more beneficial than harmful[17]
- Indonesia – 80% optimism rate[17]
- Thailand – 77% optimism rate[17]
Lower Optimism, Growing Acceptance
- United States – 39% beneficial sentiment, but +4% improvement since 2022[17]
- Canada – 40% beneficial sentiment, +8% improvement since 2022[17]
- Netherlands – 36% beneficial sentiment[17]
The trend proves encouraging: skeptical developed nations show accelerating sentiment improvements, suggesting familiarity breeds comfort. Germany, France, and Great Britain each improved by 10% or more since 2022[17].
Generative AI: The New Frontier
A emerging subdivision of AI adoption focuses specifically on generative AI tools like ChatGPT, Claude, and DALL-E:
Rapid growth: Several nations experienced generative AI adoption surges of 80%+ since October 2024, far outpacing the global average of 35% and the U.S. average of 25%[13].
Key adopters: Nations ranking 15th-18th in overall AI adoption showed the largest generative AI spikes, suggesting geographic catch-up dynamics as tools democratize[13].
This democratization through accessible interfaces (web browsers, mobile apps) accelerates adoption independent of legacy infrastructure.
Barriers to Adoption: Why Some Nations Lag
Lower adoption correlates with several factors:
- Limited digital infrastructure: Sub-Saharan Africa at 8-13% adoption rates[2]
- Lower internet penetration: South Asia below 13% adoption[2]
- Language barriers: AI tools predominantly English-language[2]
- Regulatory uncertainty: Some European nations adopting cautious approaches despite high readiness scores[18]
- Cybersecurity concerns: Organizations in conservative sectors proceed slowly[18]
- Cost barriers: SMEs in emerging markets struggle with implementation[18]
The Future: Convergence and Growth Projections
Expected Trajectories
Near-term (2026-2027):
- Global AI users expected to exceed 500 million by 2027[1]
- Emerging market adoption accelerates through mobile- first AI[1]
- Generative AI literacy becomes baseline expectation in developed economies[1]
Medium-term (2027-2030):
- Convergence of adoption rates as accessibility tools mature[1]
- Regional leadership shifts based on educational infrastructure[1]
- Sectoral maturity reaches 40-60% in healthcare, nance, and manufacturing across most developed nations[1]
Long-term implications: The global digital divide may widen or narrow based on how developing nations navigate AI infrastructure investment—this represents perhaps the most critical geopolitical question of the AI era[1].
Conclusion: Understanding AI Adoption Geography
The global popularity of AI usage presents a nuanced picture. While the United States dominates investment and compute infrastructure, countries like the UAE, Singapore, and Norway lead in actual user adoption rates. China combines scale, patents, and government direction, while Europe emphasizes accessibility and regulation. And emerging markets like India and Brazil show massive usage despite awareness gaps, suggesting organic adoption through integrated services.
The key takeaway: AI adoption isn't unidirectional or predetermined. Nations with strong digital infrastructure but lower adoption rates (like the U.S.) can still increase personal engagement through improved consumer products. Simultaneously, developing nations leapfrog legacy infrastructure through mobile AI.
For policymakers, business leaders, and technologists, these country-level dynamics reveal critical insights: accessibility outpaces investment, user experience drives adoption more than computing power alone, and awareness campaigns remain essential even in high-usage countries.
As we progress through 2026, watch for three key developments:
- Whether adoption rates in developed nations accelerate toward emerging market levels
- How generative AI continues to democratize access across geographies
- Whether regulatory frameworks create competitive advantages or disadvantages
The AI adoption story isn't finished—it's only accelerating globally.
References
- AllAboutAI. (2025, November 9). The 2025 Global AI Adoption Report: Is Your Country on This List? https://www.allaboutai.com/resources/ai-statistics/global-ai-adoption/
- Microsoft Research. (2025, June). A Population-Normalized Metric for Tracking Global AI Usage. Retrieved from https://www.microsoft.com/en-us/research/wp-content/uploads/2025/ 10/AI-Usage-Technical-Report.pdf
- Statista. (2024, June 10). AI adoption in companies 2022-2023, by region. https://www.stati sta.com/statistics/1472617/ai-adoption-companies-by-region/
- Spherical Insights. (2025, May 29). Top 10 AI Spending Countries 2025: Statistics and Trends 2024–2035. https://www.sphericalinsights.com/blogs/top-10-artificial-intelligence-spending-countries-in-2025-statistics-and-facts-analysis
- AllAboutAI. (2025, November 9). AI Readiness Index: United States Performance. https:// www.allaboutai.com/resources/ai-statistics/global-ai-adoption/
- AllAboutAI. (2025, November 9). Financial Services AI Adoption. https://www.allaboutai.c om/resources/ai-statistics/global-ai-adoption/
- AllAboutAI. (2025, November 9). Healthcare and FDA AI Device Approvals. https://www.al laboutai.com/resources/ai-statistics/global-ai-adoption/
- AllAboutAI. (2025, November 9). Technology Sector AI Integration. https://www.allabouta i.com/resources/ai-statistics/global-ai-adoption/
- Knowledge-Sourcing. (2025, September 6). Top 10 Countries Witnessing Exponential AI Adoption. https://www.knowledge-sourcing.com/resources/thought-articles/top-10-countri-witnessing-exponential-ai-adoption/
- Knowledge-Sourcing. (2025, September 6). China's AI Patent and Research Leadership. https://www.knowledge-sourcing.com/resources/thought-articles/top-10-countries-witnessing- exponential-ai-adoption/
- Vention Teams. (2024, June 25). AI Adoption Statistics 2024: All Figures & Facts to Know. https://ventionteams.com/solutions/ai/adoption-statistics
- AIPRM. (2024, January 10). AI Statistics 2024. https://www.aiprm.com/ai-statistics/
- Microsoft. (2026, January 12). AI Economy Institute—AI Diffusion: Global Rankings. https://www.microsoft.com/en-us/research/group/aiei/ai-diffusion/
- AllAboutAI. (2025, November 9). Top 10 Countries Leading in AI Adoption—Oxford Insights Index. https://www.allaboutai.com/resources/ai-statistics/global-ai-adoption/
- Knowledge-Sourcing. (2025, September 6). India's AI Adoption and Infrastructure Strategy. https://www.knowledge-sourcing.com/resources/thought-articles/top-10-countries- witnessing-exponential-ai-adoption/
- Elfsight. (2025, July 13). AI Statistics 2024–2025: Global Trends, Market Growth & Adoption. https:// .co/ai-statistics-trends-global-market/
- Stanford AI Index Report. (2024, September 9). Global Public Sentiment on AI. https://ha i.stanford.edu/ai-index/2025-ai-index-report
- Visual Capitalist. (2024, October 29). Mapped: Which Countries Are Most Prepared For AI? https://www.visualcapitalist.com/mapped-which-countries-are-most-prepared-for-ai/